Essay
The pressure to move fast
A year of moving as fast as I could, and the thing I got wrong about planning. Not that I did too little of it.
We can now do more than ever before, the limits seem to only be our imagination … and our judgement.
Something I learned this last year is that going fast and living the 9-9-6 lifestyle actually feels GOOD … until it doesn't, but not for the reason you think. It wasn't burnout, I wasn't especially tired. It feels good because it gives the illusion of no friction — just you and your agent, moving as quickly as possible, like an artist at a canvas that paints itself from the strength of your ideas. Of course a real canvas doesn't have to weigh user feedback, competitive intelligence and market analysis (ok, I lost the artist analogy there, but so be it, I still like it).
Every day ends with the feeling of incredible progress, impact and value created. The alternative is doing something like writing, what I'm doing here and now. Writing is hard when done with authenticity. It's hard because I need to admit that:
- I don't always know where to go
- It takes work to return to my humanity, and a daily morning meditation helps tremendously, but it isn't always enough (this one needs an essay of its own)
- Being more strategic and thoughtful means admitting the target destination isn't as clear as you think it is
- After a lifetime of 'being the outsider', working with an agent feels unreasonably powerful (that one needs an essay of its own too)
- It requires me to actively slow down, which is sometimes the hardest part
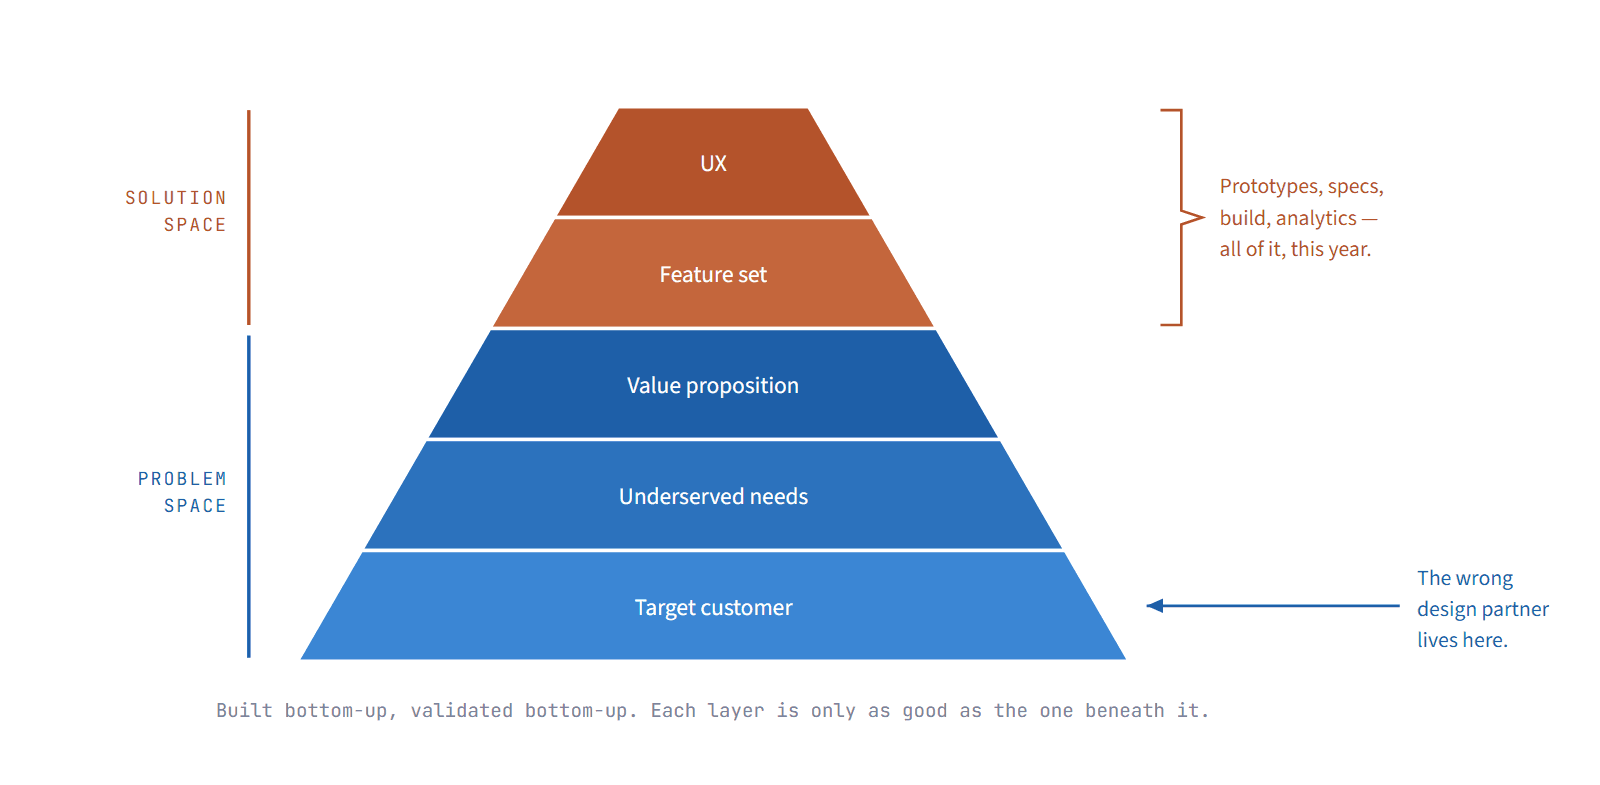
This past year I learned how to do all the things, except the really important ones. I learned how to create my own design prototypes, get feedback from design partners and turn that feedback into product specs, implement the specs and build in feature metrics and analytics. Dan Olsen draws product-market fit as a pyramid, five layers built from the bottom up: target customer, underserved needs, value proposition, feature set, UX.1 The bottom three are problem space, the top two are solution space. I first read this in 2016, and it's honestly where I feel my real work as a product manager began, this book gave me a way to tell the difference between building something and knowing who it was for. So go back and read my list again. Prototypes, specs, implementation, metrics. Every single item sits in the top two layers. I spent the year very good at the solution space and never went back down to layer one. That's the part that stings. I knew the pyramid. I've known it for ten years. Which is really just another way of asking: what if we were working with the wrong design partner?
Sure, the design partner was amazingly helpful, they WANTED the company and the product to succeed. They also wanted something that could tackle all of their primary needs before fully using the system. They wanted a complete solution to replace all of the fragmented tools they had built up over the years, because they didn't want to disrupt their core workflow to move towards a solution that only partially resolved their needs. Even moving fast, building that tool was bordering on reckless. There's no way a small startup can test and verify each of the steps they needed, with all of the variances, in a few short months. And we didn't stop to question it. The uncertainty of the actual build time was real, the desire to meet their needs was palpable, the product market fit clear and the TAM known. But the runway needed to build what the TAM needed wasn't really there, and I never stopped to question the real timeline. Startup Genome has a name for this that I didn't have at the time: premature scaling. They found 70% of startups do it on some dimension, that it accounts for 74% of high-growth failures, and that 93% of the companies that do it never cross $100k a month.2 Building a complete solution for one partner before I knew they were the right partner is premature scaling on the product dimension. It just doesn't feel like scaling while you're doing it. It feels like service.
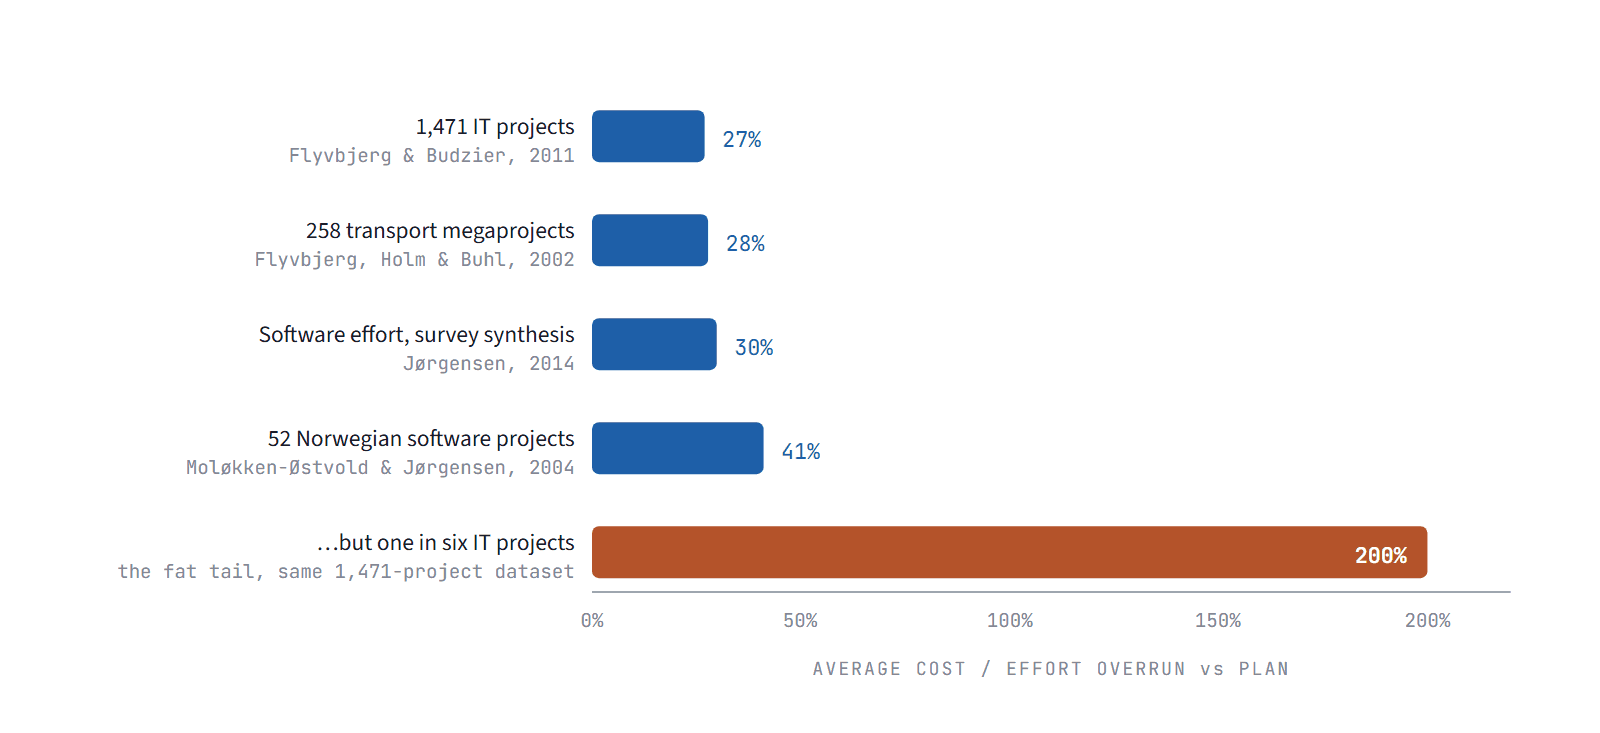
Why didn't I stop to question the timeline? Because planning has always felt like a waste of time to me. After 14 years in product, every hour, every day devoted to planning always resulted in maybe 40% more predictability if I'm being generous. The timing, the engineering and often even the sequence of steps never stuck to the plan no matter how much time we put into it. And this wasn't the fault of the team, there were just too many unpredictable issues. The research mostly agrees with the pessimistic half of that. Magne Jørgensen, who has spent a career on software estimation, puts the average effort overrun at around 30% and notes it hasn't measurably improved since the 1980s.3 Bent Flyvbjerg looked at 258 transport megaprojects worth $90B and found costs underestimated in 86% of cases, with no improvement across the 70 years his data covers.4 So no, the plan doesn't stick, and it isn't your team. I'm tempted to postulate on the 'Heisenberg planning principle', but I think that gives planning too much certainty and articulates a clear tradeoff. Perhaps you could say I've just never been in an organization that did this well. Maybe. But I've also never known an engineer or product manager who has, though perhaps that is overstating it a bit since I haven't asked everyone.
Going fast with minimal planning makes you feel like you can tame the uncertainty. If only I could execute faster, we could:
- establish clear product market fit
- win over our first customers
- trend towards stability and repeatability
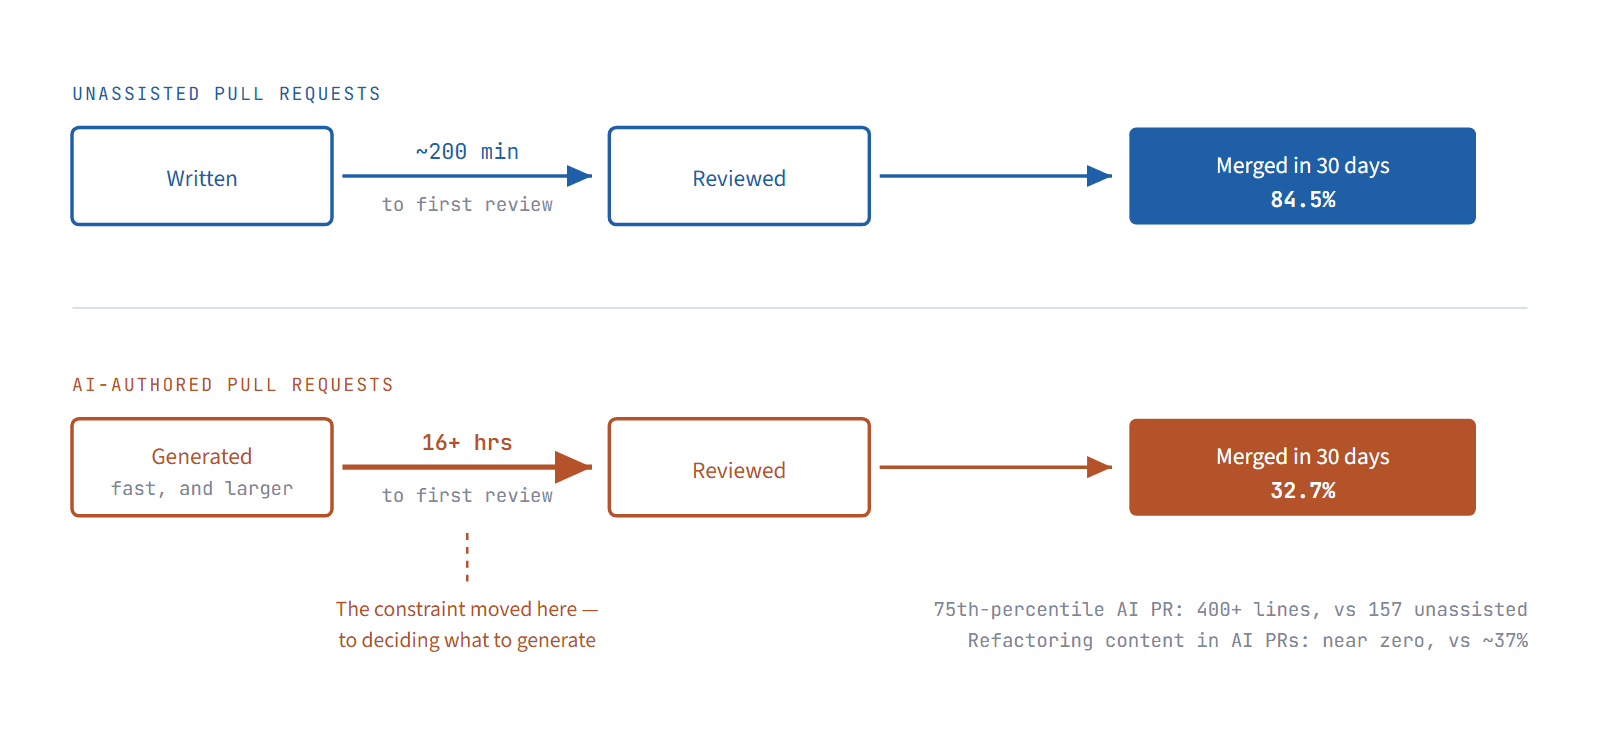
The thing is, everyone can move fast now, so what differentiates you? Or maybe differentiation is overrated, so long as you have real customers. DORA's 2025 report has 90% of developers using AI at work, a median of two hours a day, and more than 80% reporting productivity gains — while AI adoption stays associated with worse delivery stability, and 30% of those same developers report little or no trust in the code they're getting.5 LinearB looked at 8.1 million pull requests across 4,800 teams and found AI-authored PRs wait 16+ hours for a first review against about 200 minutes for unassisted ones, and merge within 30 days only 32.7% of the time against 84.5%.6 Generation got cheap. Acceptance didn't. The constraint just moved upstream, to deciding what to generate.
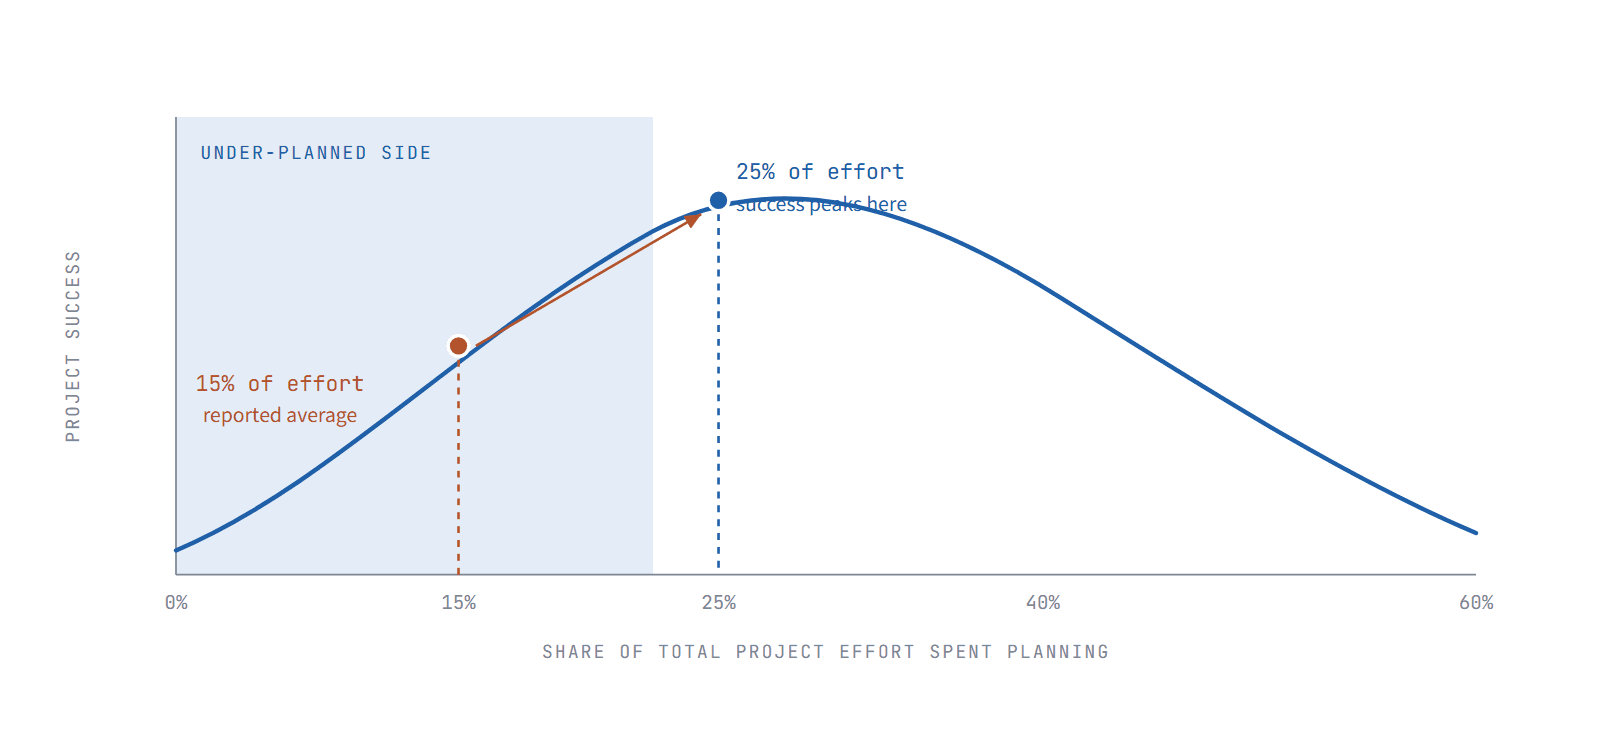
Which makes me think I've been drawing the wrong conclusion from fourteen years of plans that didn't hold. Serrador and Turner looked at 1,386 projects and found the relationship between planning effort and success is an inverted U — success peaks at around a quarter of total effort, and the average project spends fifteen percent.7 Most teams sit short of that peak. I didn't, and this is the part I've been avoiding. I didn't skip the planning this year. I wrote detailed specs, mapped user journeys, built skills to enforce the approach and an elaborate in-house eval system to verify it. By effort, I was well past the top of that curve.
It didn't help, and the reason matters more than the amount. All of it sat on top of several engineers' worth of code in various states of completion, and nobody had reconciled that code with the documentation or the architecture it was meant to implement. The specs described a system that didn't quite exist. The evals tested the architecture we had written down rather than the one we were actually running. It was rigorous work pointed at the wrong object — and because it was laborious and looked serious, it produced more confidence than moving fast ever did. That should have been the warning.
There's a pre-registered study across five frontier models where a 267-word specification before generation cut defects by 84%.8 I wrote far more than 267 words. What I didn't have was a codebase they were true about — and that study tested single-turn generation on greenfield tasks, which is the one setting where that gap can't open. So maybe what I've been calling 'planning is a waste of time' was really 'planning that isn't grounded in the real state of things is a waste of time', and those were never the same claim. It's Flyvbjerg's fix one level down: stop reasoning from your model and go look at what's actually there. I was right that the Gantt chart is theater. I was wrong about the paragraph — but only if the paragraph is true.
In retrospect, I think that going fast was actually avoiding the really difficult thing. Because doing the thing that's really hard means confronting the uncertainty and ambiguity head on, it means admitting you're not sure how to proceed, not sure where to get the right data and not sure what experiments you can design to validate you're heading in the right direction.
I think the missing step was actually taking the time to go slow. To identify the real early customers and stay away from those needing a more mature solution. To find where those customers actually are. The core Lean Product Principles still apply, despite the temptation to do away with them. So I'm going back to the bottom of the pyramid, ten years after I first learned it, which is either embarrassing or just what practice looks like. The pyramid doesn't care how fast you build the top if the bottom is wrong.
Figuring out exactly what that skateboard (or MVP, MSP what have you) actually looks like is hard, very hard. Henrik Kniberg, who drew the skateboard, would rather we called it the Earliest Testable Product, because “minimum viable” gets people arguing about the minimum instead of about the testing.9 It requires a lot of cold outreach with minimal response rates — and the rates really are minimal, B2B cold email reply rates have fallen from around 8.5% in 2019 to roughly 3–5% now across datasets covering tens of millions of sends.10 It requires doing work that may or may not produce a result, and it's easy to forget that a negative result is still a result, removing the false pathways helps clear the way for the positive one.
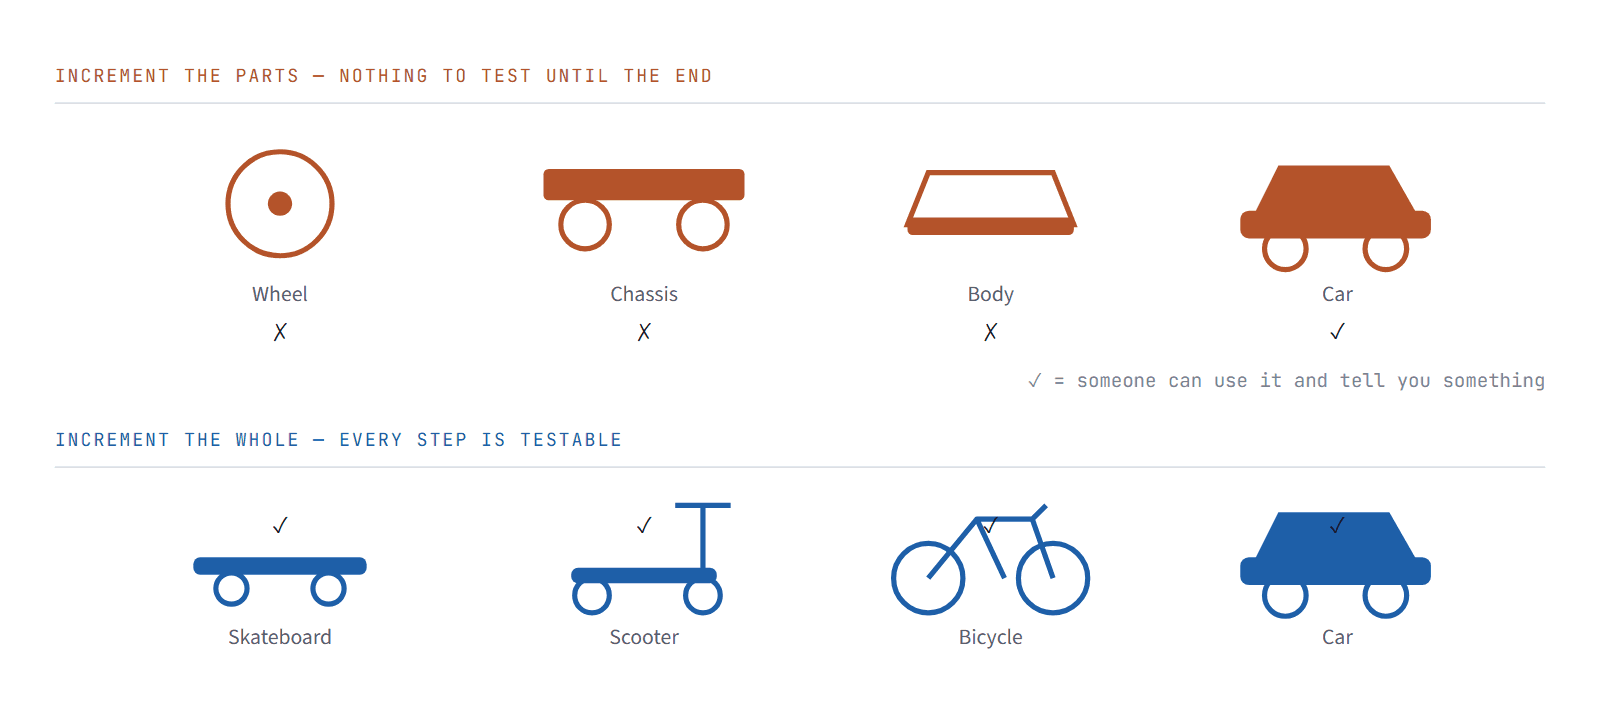
So, maybe it's good to slow down. For me, I'm trying this now with writing. Right now, I feel my writing isn't that great. I know it's missing the story that I'm not fully ready to tell yet, but it's a start. So, let this be the rekindling of my story, let this be where my new story begins.
Sources
- Dan Olsen, The Lean Product Playbook (Wiley, 2015) — the Product-Market Fit Pyramid and the six-step Lean Product Process. leanproductplaybook.com
- Startup Genome Report Extra on Premature Scaling, 2011 — 3,200+ high-growth startups. startupcompass (PDF)
- Magne Jørgensen, “What We Do and Don't Know about Software Development Effort Estimation,” IEEE Software 31(2), 2014. simula.no (PDF)
- Flyvbjerg, Holm & Buhl, “Underestimating Costs in Public Works Projects: Error or Lie?” Journal of the American Planning Association 68(3), 2002 — 258 projects, $90B. arxiv.org (PDF)
- 2025 DORA State of AI-assisted Software Development Report — ~5,000 technology professionals. dora.dev
- LinearB, “8 Million PRs: 2026 Engineering Benchmarks” — 8.1M pull requests, 4,800 teams, 42 countries. linearb.io
- P. Serrador & J. R. Turner, “What Is Enough Planning? Results From a Global Quantitative Study,” IEEE Transactions on Engineering Management 62(4), 2015 — 1,386 projects. eprints.whiterose.ac.uk
- Dhuri, “Specification-first generation,” arXiv preprint, September 2026 — pre-registered, five frontier models, 50 backend tasks. arxiv.org
- Henrik Kniberg, “Making sense of MVP (Minimum Viable Product),” Crisp's Blog, 25 January 2016. blog.crisp.se
- Hunter.io, “The State of Cold Email.” hunter.io
A note on what was left out
Three widely circulated statistics were deliberately excluded. The Standish Group CHAOS success rates, because the method fails replication — Jørgensen showed the famous 189% overrun figure carries three mutually inconsistent definitions in Standish's own documents, and Eveleens & Verhoef got success rates anywhere from 6% to 70% out of the same 5,457 forecasts depending only on each organisation's estimation bias. The MIT NANDA “95% of enterprise GenAI pilots fail” figure, because it is self-labelled preliminary, was never peer reviewed, and Wharton's Kevin Werbach has said publicly that he cannot find where the number comes from. And METR's “AI made experienced developers 19% slower” result, because METR itself put a banner on that study in February 2026 saying it no longer reflects current model impact.
Figure 4 draws a schematic curve through reported data points: the two marked values are published figures, the shape between them is illustrative. Figures 1, 2, 3 and 5 plot or depict reported values directly.